 EU News Digest Latest News & Updates
A chorus of analysts has called the end of the 30-year bond bull market. Not so fast, says one trader.
“I have about six reasons in total from a technical perspective to be at least counter-trend bullish bonds right now,” Paul Ciana, global chief FICC technical strategist at Bank of America, told CNBC’s “Futures Now” on Tuesday.
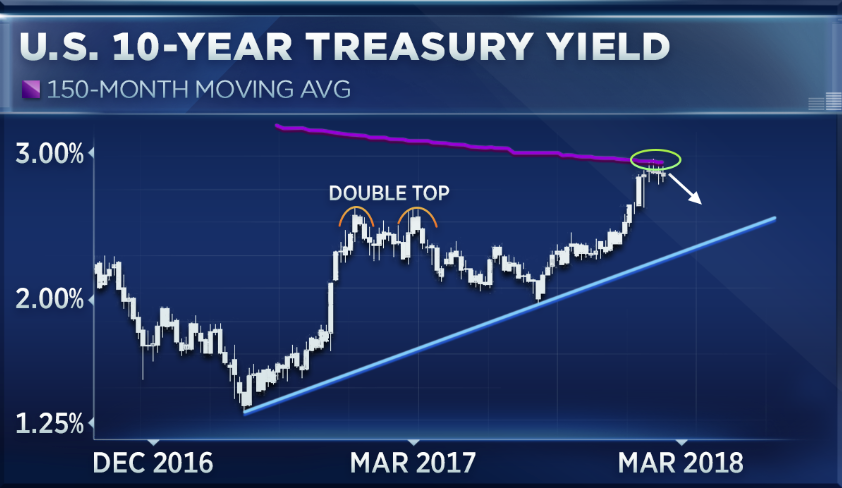
Look at the charts on the 10-year Treasury yield, he says. Yields have risen to touch their 150-month moving average, a move not seen since 2007 when yields peaked. Since hitting that level in the past few weeks, yields have not tipped over that average.
The candle pattern structure on the 10-year in recent weeks also indicates that yields have entered overbought territory and are “at risk for rolling over to the downside,” said Ciana. The relative strength index, a measure of momentum that indicates overbought conditions, is holding at an elevated level.
“The RSI of the weekly 10-year yields chart is hovering at about 74, which means yield is overbought or the bond market is oversold to a rather stretched position and could correct,” said Ciana.
Momentum also appears to be slowing down, he noted, adding that it looks as though the “market took the foot off the gas” as yields crept higher. The yield on the 10-year Treasury has held around four-year highs since hitting those levels in February. Ciana said that the “sell yield, buy bond signal” is at its peak this year.
The setup on the bonds market also looks similar to how yields traded last March. At that time, the 10-year yield formed a double top, trading at 2.6 percent to 2.7 percent before declining to 2 percent. If the market repeats history, yields should fall and could retest the 2.6 percent level of early 2017.
Finally, movement on the moving average convergence-divergence indicator has Ciana feeling counter-trend bond bullish at this time. That indicator measures movement between two moving averages of prices, usually a shorter period exponential moving average against a longer period.
“The MACD indicator on our daily chart has already crossed lower,” said Ciana. “It’s pointing to lower yields and has plenty more room to trend lower before it truly crosses that zero line.”
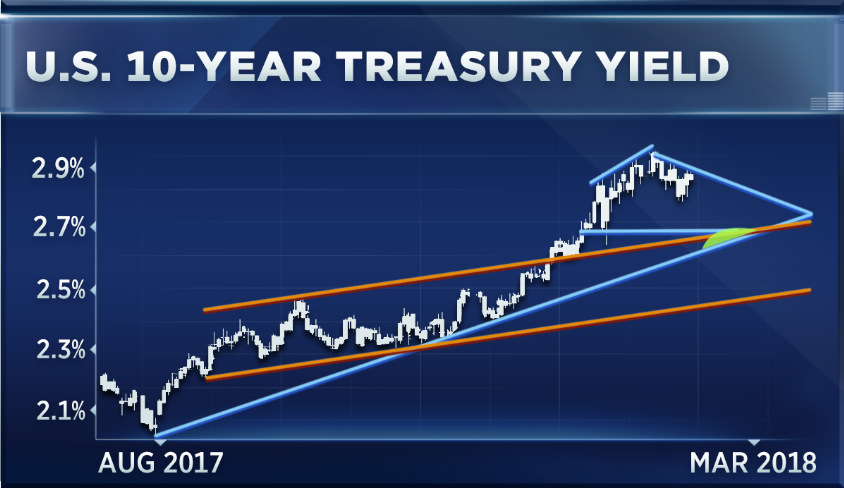
Ciana remains on the lookout for signs his theory could prove incorrect. The most important move, he says, would be if yields reach above the highs already hit earlier this year.
“If we start to creep above 2.95 [percent] and start making new yield high this year, that probably means this counter-trend bounce isn’t working or is already over,” he said.
Yields reached a year-to-date peak of 2.94 percent on Feb. 21. The 10-year yield has not reached above 3 percent since January 2014.
Bond prices have generally been on a downtrend this year as stronger inflation, a ready-to-move Federal Reserve, and expected economic stimulus from tax cuts raised the prospects of higher interest rates. Bond prices and yields move inversely to one another — as prices fall, yields rise.
The 10-year Treasury bond yield was slightly lower on Wednesday, trading at 2.859 percent. Yields have risen 18 percent since the beginning of the year.