 EU News Digest Latest News & Updates
Stocks are on pace for their best week since June, closing the book on a month plagued with major sell-offs.
The S&P 500 is up more than 2% this week, cutting down August losses. At its worst, the index had fallen more than 5% this month.
The worst may not be behind the markets quite yet, says Frank Cappelleri, executive director and chief market technician at Instinet. He says three charts back up his case.
“If you look back at the S&P since the beginning of 2018 when volatility really came back into the picture, there’s been a handful of very violent downturns and they’ve varied in terms of degree of decline and their length. But each one of them really continued until we saw capitulation, and then a positive reversal,” Cappelleri said Thursday on CNBC’s “Trading Nation.”
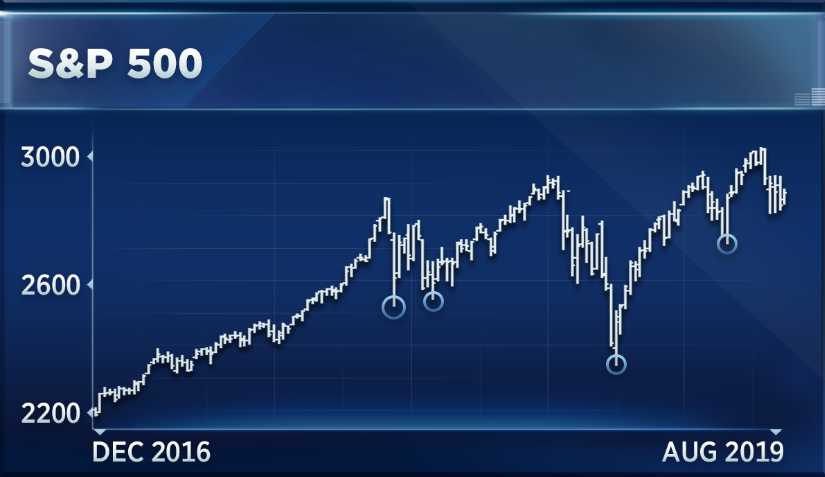
This time looks different, he said. While demand materialized at the lower end of the trading range, efforts to push back higher quickly faded and the S&P 500 rolled back over. If this continues, the buyers driving the market higher may grow fatigued, Cappelleri added.
The market is also mirroring trading patterns seen last year, he added. In October and November, the S&P 500 declined to 2,600, returned to 2,800 twice and then tumbled lower. That set off the major decline to December lows.
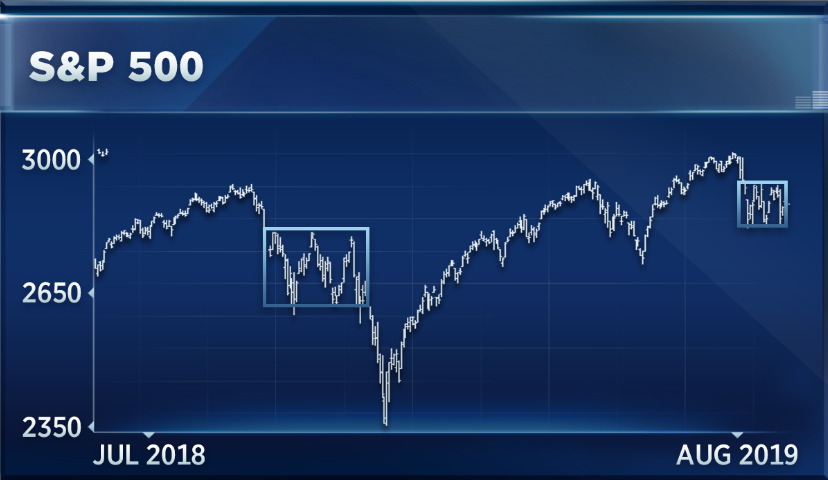
“I’m not saying that there’s going to be a downturn of that magnitude here. But as long as we continue to stay in that range right now, I think we have to consider that there’s going to be another downturn at some point,” said Cappelleri.
Higher levels of volatility this month could also bleed over into the next stretch, he said. August has seen 11 moves of at least 1% in either direction, its most in roughly 18 months. When that happens, there are “clusters,” and volatility tends to roll on through the following months, Cappelleri noted. In February of 2018, for example, volatility came back in force, kicking off more wild swings through March and April.
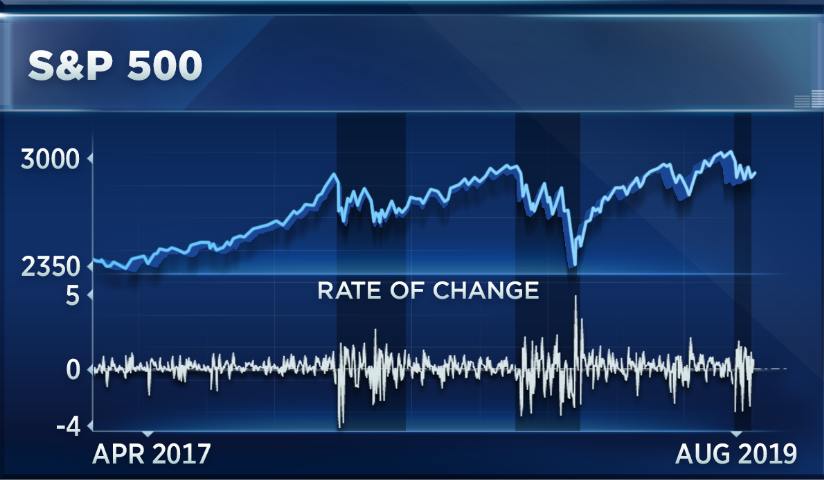
“Go back to last October, November, December, it happened as well,” said Cappelleri. “So could this August be an aberration and we go back to new highs with no volatility? It could, but I think we have to look at recent history and realize that these big moves could be with us for a while, even if we don’t get a big downturn.”
The VIX volatility index spiked above 24 this month, its highest level since the December slump. It currently trades at 19.