 EU News Digest Latest News & Updates
Rising oil prices have breathed new life into the oil patch, but the sudden enthusiasm has made CNBC’s Jim Cramer wonder if it can all be chalked up to irrational exuberance.
So the “Mad Money” host called on technician Carley Garner, the oil-savvy co-founder of DeCarley Trading and author of Higher Probability Commodity Trading, to help explain the positive action.
“Garner’s worried that the same animal spirits luring speculators into high-flying stocks and even cryptocurrencies may have migrated to the oil market,” Cramer said.
With that, he turned to Garner’s first chart: the weekly chart of West Texas Intermediate crude, complete with the Commodity Futures Trading Commission’s Commitments of Traders report.
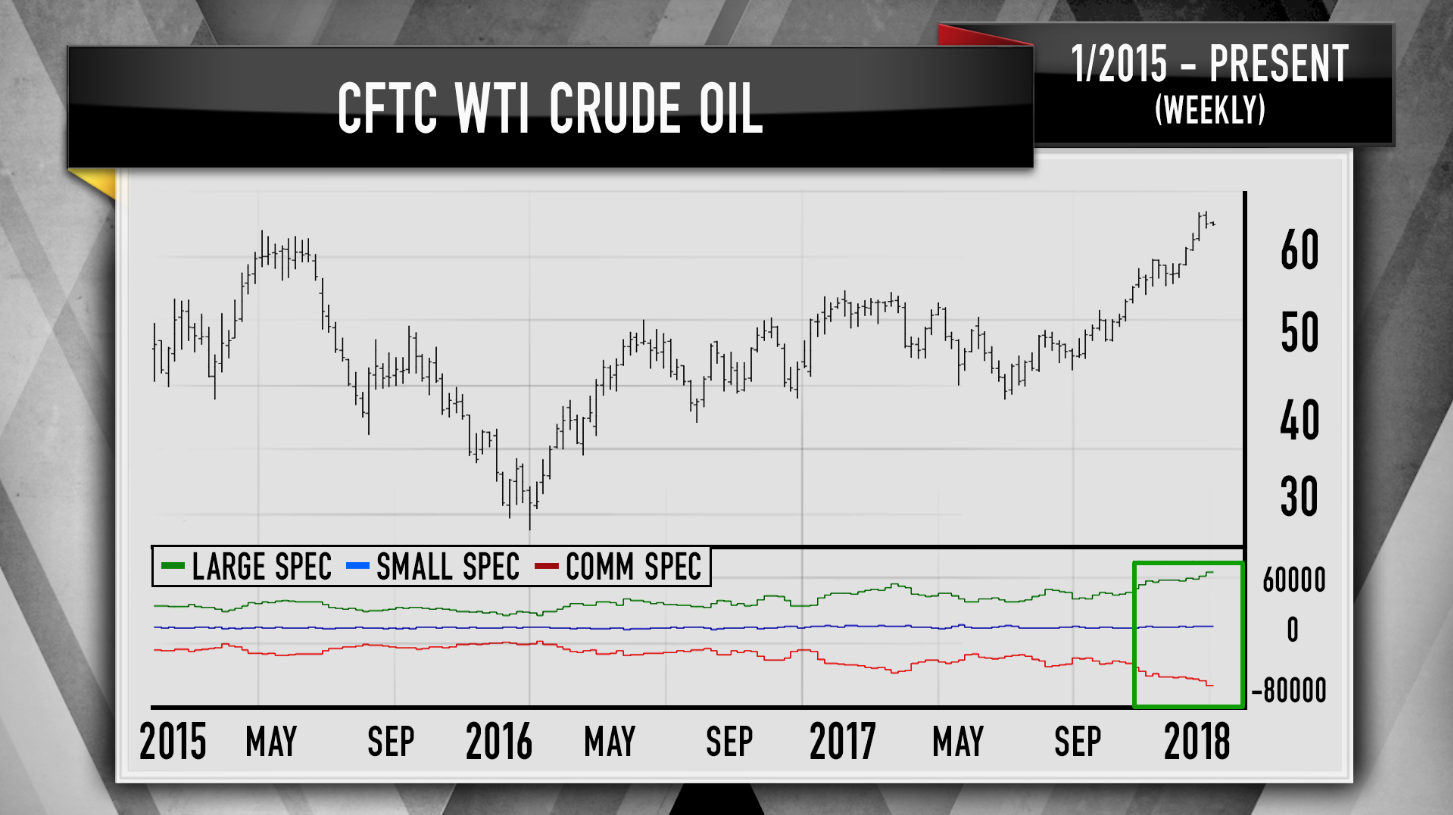
The Commitments of Traders report is essential to Garner’s analysis. It depicts the net long or net short positions of large speculators, or professional money managers, small speculators, or individual investors, and commercial hedgers, or companies that buy oil futures contracts.
By seeing where the big players are positioned, Garner can usually predict changes in oil’s trajectory. When everybody has a long position, that means there are no buyers left, so prices are likely to slump; when everybody is short oil futures, that means there are no sellers.
“As of last week, large speculators were holding the single largest bullish position in the history of crude oil futures: … 666,000 net long contracts,” Cramer said. “Being bullish is not a good sign.”
While Garner acknowledged that this trend could continue forever — buyers could just keep buying oil hand over fist indefinitely — she said that the trend was more likely to falter.
“As Garner points out, when one of these massive speculative bets in oil unwinds, you do not want to get caught anywhere near the blast radius,” Cramer said.
After all, 666,000 futures contracts represent 666,000 opportunities for potential sellers to slash their positions if things go wrong. If everyone moves at once, Garner predicted it could push crude prices back down to $50 a barrel.
The technician also called attention to the daily chart of oil versus the dollar index, which measures the dollar against other currencies.
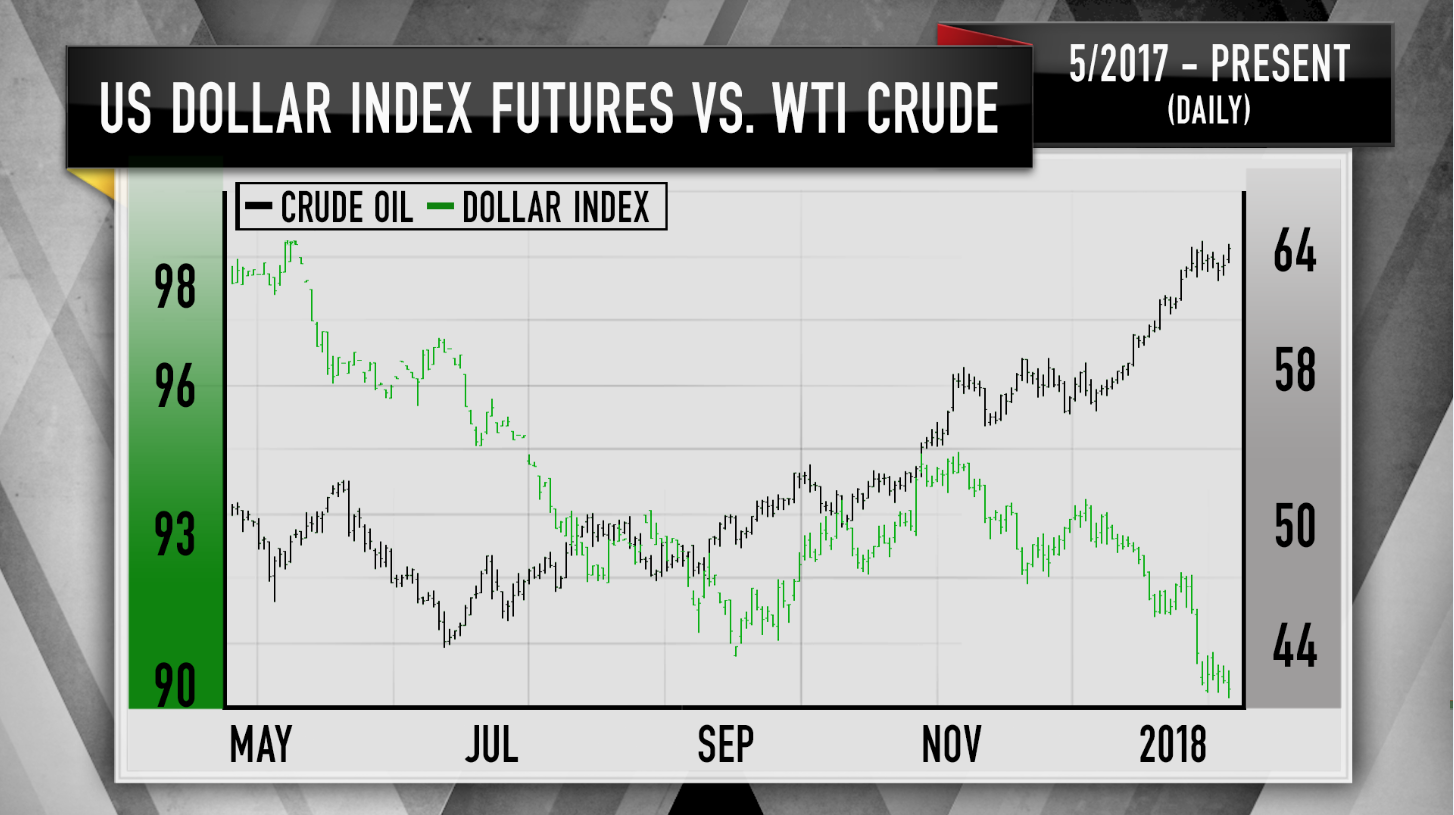
Because crude is denominated in dollars, the two are correlated: as the dollar weakens, oil prices soar. But that correlation goes both ways, Garner said.
“She thinks that the dollar has now slithered down to areas where it should be able to find a floor of support,” Cramer said. “If the greenback stops falling, well, that will remove a major prop underneath the oil rally.”
Building on that, the dollar index tends to find support at the 90 level, where it is currently trading, so Garner thinks the chances of it reversing and going higher are not all that low.
“Put it all together and Garner thinks the chances of a continued oil rally are pretty darned slim, and, by the way, the long-term futures suggest the same thing — when you look at the price of crude out five years, [it’s] much lower,” Cramer said. “The charts, and especially the huge net long position in the CFTC’s Commitments of Traders report, make Garner worry that oil could be ready and prime for a pullback. My view? Proceed with caution.”