 EU News Digest Latest News & Updates
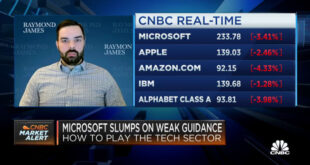
The stock market rally that began 2019 has not yet run its course, even with Tuesday’s Washington-induced surge, CNBC’s Jim Cramer said after consulting with technician Carley Garner.
“The signs suggest that this market can have more upside before the rally exhausts itself,” Cramer recapped on “Mad Money.” “Eventually the market will become too optimistic and stocks will peak, but we’re not there yet.”
Garner, the co-founder of DeCarley Trading and author of Higher Probability Commodity Trading, has an impressive track record. In mid-December, one week before the Christmas Eve collapse and subsequent rebound, she told Cramer that pessimism was peaking and stocks were due for a bounce.
But now that the S&P 500 has gained over 15 percent since those midwinter lows, it’s worth wondering the reverse: what if optimism is approaching its peak?
Lucky for Wall Street, Garner says it’s not. She called attention to CNN’s Fear and Greed index, which uses a variety of inputs to measure what CNN sees as investors’ chief emotional drivers.

Right now, the index sits at 67 out of 100, signaling more greed than fear, but still “a far cry from the extreme levels where you need to start worrying,” Cramer explained. When the major averages peaked going into the fourth quarter of 2018, the index hit 90, and according to Garner, “we usually don’t peak until we hit 90 or above,” he said.
Add to that the fact that only half of professional traders and investors polled for the most recent Consensus Bullish index said they felt bullish; the recent downtrend in the Cboe Volatility Index, which tracks how much investors think stocks will swing in the near future; and that, historically, this is a good time of year for stocks; and Garner sees more momentum ahead.
The S&P 500’s technical charts seem to uphold Garner’s theory. Its weekly chart shows fairly neutral readings for two key indicators: a momentum tracker called the Relative Strength Index and the slow stochastic oscillator, which measures buying and selling pressure.

“Even if the S&P 500 keeps climbing to, say, … 2,800 — up 2 percent from here — Garner doesn’t anticipate either the RSI or the slow stochastic [to] hit extreme overbought levels,” Cramer said, adding that the technician could even see the S&P climbing to 3,000 if it breaks above the 2,800 level.
If Garner is wrong and the S&P heads lower, she said it could trade down to its floor of support at 2,600, and if it breaks below that, fall to 2,400. But that scenario is highly unlikely and, if it happens, would be a buying opportunity, she noted.
The S&P’s monthly chart told a similar story, Cramer said. The index is currently trading at 2,746, between its “hard ceiling” at 3,000 and its “hard floor” of 2,428, he said, which means it’s “basically in equilibrium.”
“To Garner, that means going higher is the path of least resistance for the S&P,” the “Mad Money” host said. “Once the S&P climbs to 2,800, or perhaps … to the mid-2,900s, that’s where Garner expects things will turn south and the pendulum will start swinging in the opposite direction.”
“Remember, … Carley Garner has been dead-right, and the charts, as interpreted by Carley, suggest that this market still has some more upside here,” Cramer continued. “But if we get a few more days like this wild one, she thinks we’ll need to start worrying about irrational exuberance. For now, though, she thinks we are headed higher, and I agree.”