 EU News Digest Latest News & Updates
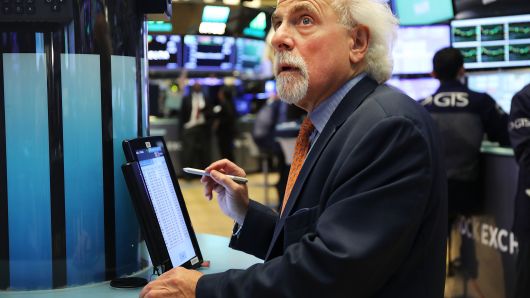
Spencer Platt | Getty Images News | Getty Images
NEW YORK, NY – OCTOBER 04: Traders work on the floor of the New York Stock Exchange (NYSE) on October 4, 2018 in New York City. With bond prices dropping interest rates have been surging resulting in the Dow Jones Industrials Average falling over 200 points at the close. (Photo by Spencer Platt/Getty Images)
Stocks had their worst day in eight months on Wednesday after a sharp downturn in tech shares, coupled with persistently higher interest rates, spooked investors.
Technology is one of the best-performing sector in the market, with companies like Microsoft and Apple having posted sharp gains for the year. However, the S&P 500 technology sector had its worst day in seven years on Wednesday, dragging the major indexes lower.
Equities had been under pressure heading into Wednesday’s session as Wall Street that higher borrowing costs will slow down the economy.
Below is a look at some of the most staggering stats from Wednesday’s sell-off:
- The Dow Jones Industrial Average closed 831.83 lower at 25,598.74, its worst day since Feb. 8, when it fell 1,033 points. The Dow also closed below its 50-day moving average for the first time since July 6.
- The S&P 500 dropped 3.3 percent to 2,785.68, marking its biggest one-day decline since Feb.8, when it fell 3.8 percent. The broad index also posted its first five-day losing streak since November 2016. It also closed below its 100-day moving average for the first time since June 27.
- The Nasdaq Composite plummeted 4.08 percent to 7,422.05. Wednesday was the tech-heavy index’s worst day since June 24, 2016, when it dropped 4.12 percent. It also broke below its 200-day moving average for the first time since June 29, 2016.
- The Russell 2000 slid 2.86 percent to 1,575.41, notching its worst day since Feb. 8. That day, it plummeted 2.93 percent. The small-caps index also closed below 9.6 percent below a record set on Aug. 31.
- The Cboe Volatility index (VIX) widely considered the best gauge of fear on Wall Street, surged 43.9 percent to 22.96, its highest level since April 6, when it hit a high of 23.12.
- All 11 S&P 500 sectors closed lower, with tech leading the charge. Tech fell 4.8 percent, turning in its biggest one-day drop since Aug. 18, 2011, when it lost 5.3 percent. Materials and communications closed in correction territory, having shed more than 15 and over 11 percent, respectively, since hitting their 52-week highs.
- Tiffany and Twitter were the worst-performing stocks in the S&P 500, dropping 10.2 percent and 8.5 percent, respectively.
- More than 330 of the 505 stocks in the S&P 500 closed more than 10 percent below their 52-week highs. Over 140 of them ended the session in bear-market levels, or down more than 20 percent from their one-year highs.
- Dow Transports fell 4.05 percent, notching their worst day since June 24, 2016, when it fell 4.58 percent. It also posted its first five-day losing streak since June 28.
- Homebuilders fell sharply once again. The iShares U.S. Home Construction ETF (ITB) dropped 1.6 percent, marking its tenth decline in 11 sessions.