 EU News Digest Latest News & Updates
With discounts and deals top-of-mind for consumers this holiday shopping season, CNBC’s Jim Cramer zeroed in on another type of discount happening in the stock market.
“Let’s talk about Square, SQ, the payment technology company with a very popular mobile credit card reader and a stock that got put on sale big-time yesterday, losing 16 percent of its value thanks to a downgrade from research firm BTIG,” the “Mad Money” host said on Tuesday.
Before the most recent decline, shares of Square had tripled since the start of 2017. Its latest run came after management announced it would launch a program that let Square customers trade bitcoin, the wildly popular digital cryptocurrency.
But after the stock’s plunge on Monday, Cramer brought in his RealMoney.com colleague, technician Tim Collins, to help the “Mad Money” host get a better picture of Square’s trajectory.
“As far as Collins is concerned, you need to be very careful with this one now, even after today’s rebound,” Cramer said. “When a stock that’s speeding down the highway slams right into a retaining wall, you don’t buy it hand over fist at the first sign of stabilization like we had today. That’s too risky. First, you need to take a step back. Consider the carnage.”
Collins started by going over the series of Fibonacci levels in Square’s weekly chart. The ratios, discovered by medieval mathematician Leonardo Fibonacci, are repeated patterns found in things like pine cones, snail shells and, oddly enough, the stock market. Technicians like Collins use Fibonacci sequences on a stock’s past moves to get a sense of where it’s going next.
The sequences showed that Square could still fall to as low as $32.48, which would retrace more than 60 percent of its rally. While Collins found it hard to believe that the stock would shed that much of its value, he found strong floors of support at the $35 and $38 levels.
“Now, Collins is absolutely not saying that Square is going to $35,” Cramer said. “For all we know, the stock actually may have bottomed today and is part of a longer term move higher. But if this bounce turns out to be short-lived and this stock gets pounded again, these are the levels Collins thinks you should watch.”
Next, Collins turned to the more standard weekly chart of Square.
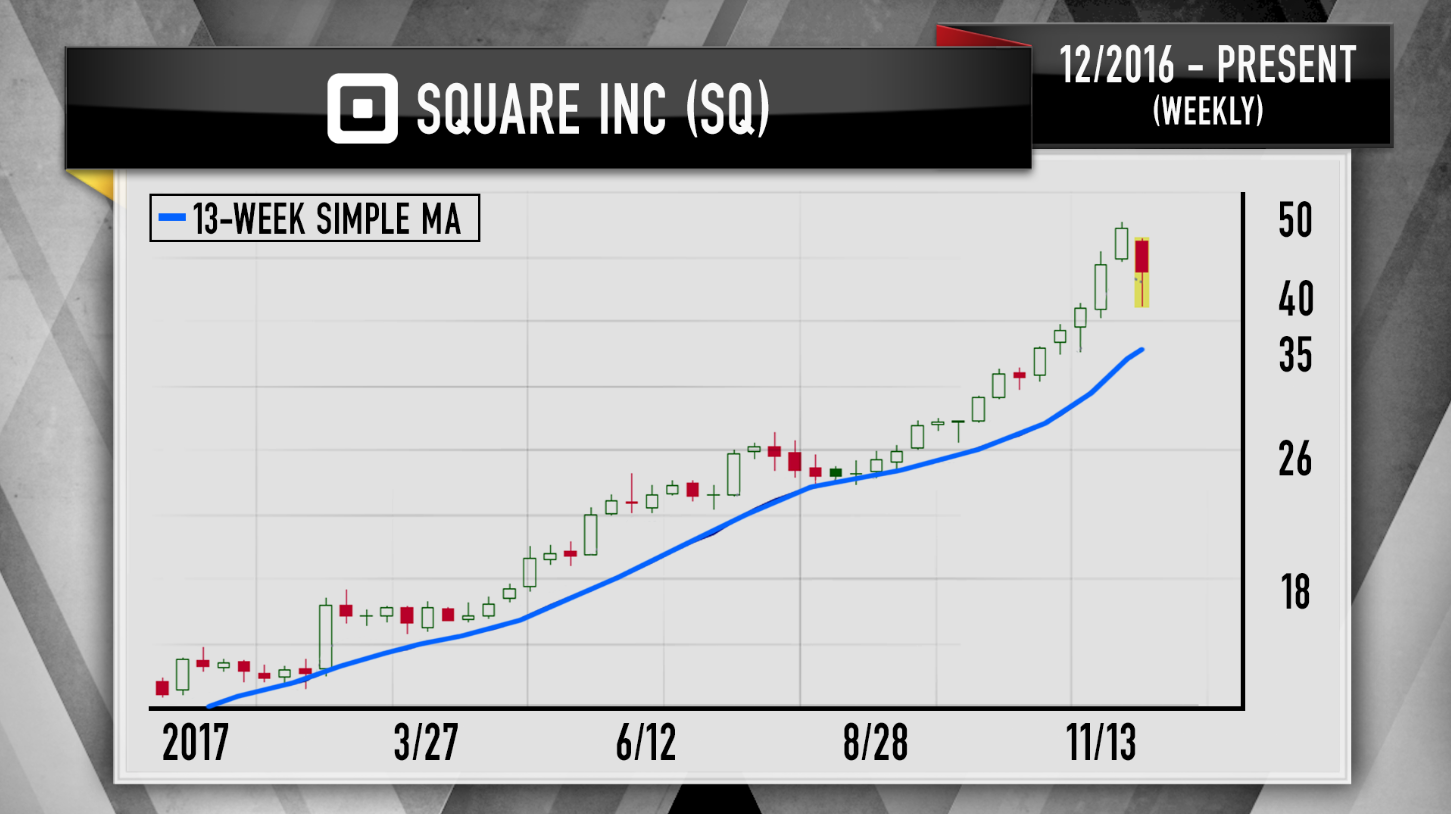
Collins noted that Square’s stock hasn’t gone below its 13-week moving average, a medium-term way to track a stock’s yearly trajectory. The moving average is at $35, close to Collins’ aforementioned floor of support.
If Collins’ analysis is accurate, Cramer said Square’s floor would indeed fall somewhere in the mid-$30s, a far cry from the now-$42 stock.
That said, Cramer once again warned that Collins was not predicting that Square shares would decline to the mid-$30s.
“He’s simply saying that if it does go into a tailspin — and stocks that have this kind of dead cat bounce, they can continue to fall — he wouldn’t recommend trying to bottom-fish until it sinks to the mid-to-high-$30s,” the “Mad Money” host said. “That may sound very cautious, but if Square can lose 16 percent of its value off a single downgrade, well, it might happen again. From a technical perspective, Square [is] not a bargain.”