 EU News Digest Latest News & Updates
CNBC’s Jim Cramer and legendary technician Larry Williams say shares of IBM, an old-line technology giant that has transitioned its business to the cloud, could be ready to rally even after the company’s disappointing earnings report.
Last Tuesday, IBM missed analysts’ revenue predictions in its third-quarter earnings report, with overall revenue declining 2 percent year over year and some of its faster-growing sections underperforming.
IBM’s stock shed as much as 5 percent in response to the report. Now, shares of the company are near levels not seen since January 2016.
But according to Williams, who has traded futures, commodities and stocks for over 50 years, written 11 books, created numerous technical indicators and runs IReallyTrade.com, IBM’s stock has some key technical trends working in its favor.
He and Cramer, host of “Mad Money,” pointed to IBM’s weekly chart. The action in the stock of IBM is represented by the black line, while the red line combines two of the stock’s dominant past trends: a 325-day cycle and a 145-day cycle.

“Now, these cycles would’ve predicted the recent declines in IBM’s stock,” Cramer said. “More importantly, when you project them forward, they suggest the stock could be ready to roar higher here.”
Williams cross-referenced this chart with one showing IBM’s typical seasonal pattern, represented below by the red line. In an average year, IBM’s stock tends to rally starting in the last week of October, the technician noticed.

And while Cramer often jokes that technical analysis can be a lot like astrology, where there’s no guarantee of reliability, he admitted that some patterns — especially those Williams spots — can be counted on more than others.
“[Williams] found that buying IBM on the 19th trading day of October … has produced 48 winning trades over the last 48 years, as long as you use a $9 stop, and then you hold it for 5 days and sell once you get an up day after that,” the “Mad Money” host said. “As things go, [that’s] pretty darn good.”
Even if this year breaks the streak, “at the very least, Williams has good reason to think that IBM may be poised for at least a short-term bounce here,” Cramer added.
Williams backed up his theory even more by applying the Williams COTSI, an indicator that helps identify whether big institutions are buying a given stock or not, to IBM’s daily chart. It is represented by the blue line below.
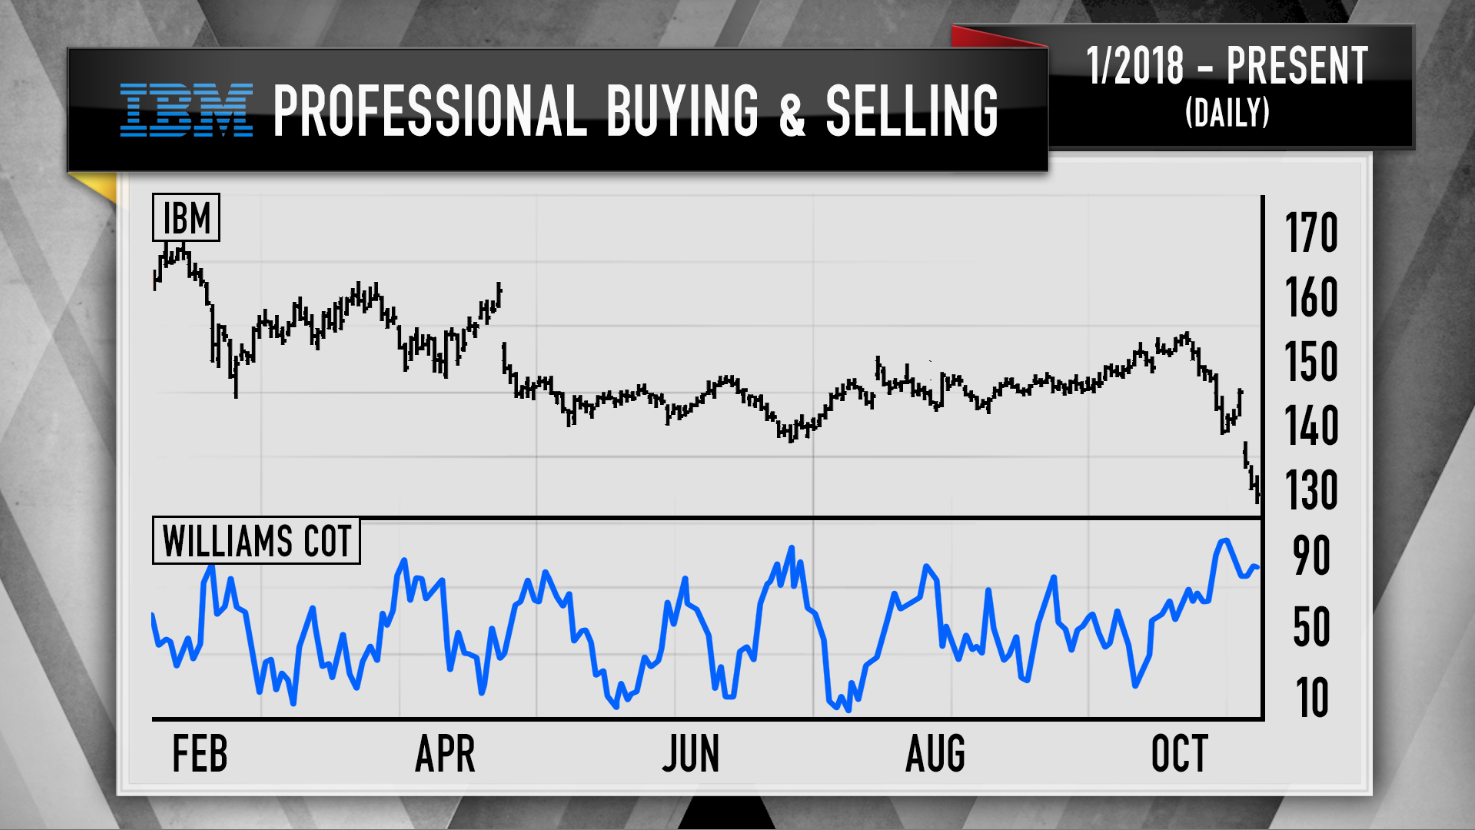
“Right now, this chart suggests that the big boys are buying IBM hand over fist,” Cramer said. “Maybe they’re attracted to IBM as a value stock at these levels. It’s got good yield, right? Maybe they believe the Fed will relent and all things tech will be able to bounce. Maybe they think that the tech rally [on Monday] is for real and it’s going to include IBM. No matter what, the one thing we know about institutional buying is that it tends to send stocks higher.”
So, in a market where many investors are feeling “dispirited” by the volatility and aren’t as eager to do some buying, there are still opportunities, even in downtrodden stocks like IBM, Cramer said.
“Here’s the bottom line: this market has gotten pretty ugly. I’m not denying that,” the “Mad Money” host said. “But sometimes, the charts can point you to opportunities in the most unlikely places. Right now, the charts, as interpreted by the legendary Larry Williams, suggest that IBM’s worth buying here.”
Shares of IBM traded slightly higher in Monday’s trading session, settling up 0.71 percent at $130.02 a share.