 EU News Digest Latest News & Updates
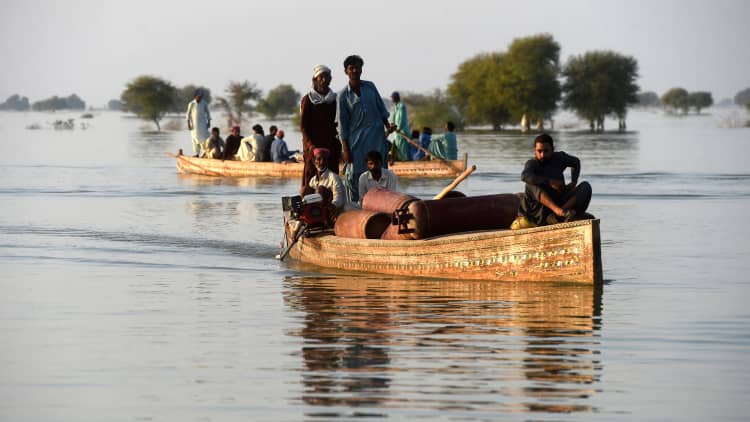
A girl sits on a cot as she crosses a flooded street at Sohbatpur in Jaffarabad district of Balochistan province in Pakistan on October 4, 2022.
Fida Hussain | Afp | Getty Images
“The climate time bomb is ticking,” António Guterres, the Secretary-General of the United Nations, said this week in Interlaken, Switzerland, after scientists released the latest Intergovernmental Panel on Climate Change report on the state of climate change.
These eight charts, included in the IPCC’s report published Monday, show what a “climate time bomb” is.
The Paris Climate Agreement, a landmark global treaty signed in 2015, aims to limit “the increase in the global average temperature to well below 2°C above pre-industrial levels,” and ideally “to limit the temperature increase to 1.5°C above pre-industrial levels.”
So far, collective action is insufficient to meet those targets.
1. Current action to reduce greenhouse gasses is insufficient to meet Paris Climate Agreement goals
This chart shows that current action to reduce greenhouse gasses is insufficient to keep global warming to the targets established by the landmark Paris Climate Agreement from 2015. Intergovernmental Panel on Climate Change (IPCC) Sixth Assessment Report
Intergovernmental Panel on Climate Change (IPCC) Sixth Assessment Report
Global warming is caused when greenhouse gases like carbon dioxide and methane trap heat in the atmosphere.
Carbon dioxide is the single largest contributor to global warming, and methane is the second largest contributor to climate change.
Carbon dioxide stays in the atmosphere longer than methane, which is more potent. In the first two decades after methane is emitted, it’s more than 80 times as potent as CO2 at trapping heat, according to NASA.
Reducing greenhouse gasses is the most critical and fundamental solution to climate change. Right now, the policies that have been implemented to limit greenhouse gas emissions are insufficient to keep global warming within the target established by the Paris Climate Agreement.
More needs to be done, quickly, in order to reach the goals set by the Paris Climate Agreement, according to scientists.
2. Climate change is already having impacts on human life and well-being
This chart shows the various impacts climate change has on water availability, food production, health and well-being, cities and infrastructure and biodiversity and ecosystems. Chart is from the Intergovernmental Panel on Climate Change (IPCC) Sixth Assessment Report.
Intergovernmental Panel on Climate Change (IPCC) Sixth Assessment Report
3. How climate change is addressed now will determine how future generations are affected
Changes in annual global surface temperatures are shown here as stripes. The way climate change is addressed now determines how future generations will be impacted. Chart is from the Intergovernmental Panel on Climate Change (IPCC) Sixth Assessment Report.
Intergovernmental Panel on Climate Change (IPCC) Sixth Assessment Report
Many of the worst impacts of climate change will come to pass in the lives of the youngest humans.
“Extreme weather is already causing more suffering, and if we don’t get to net-zero emissions, our grandchildren will grow up in a world that is dramatically worse off,” Microsoft co-founder and philanthropist Bill Gates wrote at the end of 2022.
A survey of 10,000 young people ages 16 through 25 in ten countries (Australia, Brazil, Finland, France, India, Nigeria, Philippines, Portugal, the UK, and the U.S.) found that 59 percent of young people were “very or extremely worried,” about climate change. And 84 percent of young people are at least moderately worried, according to the 2021 study published in The Lancet.
4. Climate change is not binary: Every little bit of global warming makes things more dangerous
This chart shows the projected changes temperature, soil moisture and precipitation at global warming levels of 1.5°C, 2°C, 3°C, and 4°C relative to baseline levels from the period of 1850–1900. Intergovernmental Panel on Climate Change (IPCC) Sixth Assessment Report
Intergovernmental Panel on Climate Change (IPCC) Sixth Assessment Report
The globe has warmed by 1.1 degrees Celsius above pre-industrial levels, the IPCC report says.
And while a tenth of a degree may not seem like a lot when thinking about the temperature in your living room, that change has a massive implication for the planet.
“Our normal context for temperature is our body’s temperature or the temperature in the room, and, we’re obviously not tracking that to 10ths of a degree,” Gavin Schmidt of the NASA Goddard Institute for Space Studies previously told CNBC. “But the context for the planet is a very different thing.”
For example, the last ice age about 20,000 years ago was 5 to 6 degrees Celsius (9 to 11 degrees Fahrenheit) colder than the pre-industrial age and the world was completely different: There were huge ice sheets on North America and Europe, the sea level was some 400 feet lower than it is now due to the freezing conditions and woolly mammoths walked the tundra landscape.
“Totally different planet,” Schmidt told CNBC in January. “When we say the planet has warmed more than a degree Celsius in the last hundred years, that is one-fifth of the difference between then and the ice age,” he said.
5. Climate change does not impact everyone the same: People and animals in some locations are at much greater risk than others
This infographic shows the impact of climate change to animal and plant life, human life and food production at various levels of global warming. This chart is from the Intergovernmental Panel on Climate Change (IPCC) Sixth Assessment Report.
Intergovernmental Panel on Climate Change (IPCC) Sixth Assessment Report
A slight change in the average change of the earth’s temperature will impact different populations differently.
The populations that have contributed the least to global warming are the most severely impacted.
“Almost half of the world’s population lives in regions that are highly vulnerable to climate change. In the last decade, deaths from floods, droughts and storms were 15 times higher in highly vulnerable regions,” said Aditi Mukherji, one of the 93 authors of this Synthesis Report published on Monday, in a written statement released alongside the report.
6. The largest industries in the world, including energy and food production, need to change
Responding to climate change requires overhauling virtually all major systems including energy supplies, how food is produced, how water is managed, and where people live, to name a few. This infographic highlights the relative climate impact of various responses and adaptations. This chart is from the Intergovernmental Panel on Climate Change (IPCC) Sixth Assessment Report.
Intergovernmental Panel on Climate Change (IPCC) Sixth Assessment Report
Because climate change mitigation efforts are insufficient, “humanity is on thin ice – and that ice is melting fast,” Guterres said.
That said, reaching the target goal of the Paris Agreement, 1.5 degrees Celsius, is still achievable, Guterres said.
“But it will take a quantum leap in climate action,” Guterres said.
“We have never been better equipped to solve the climate challenge – but we must move into warp speed climate action now,” he said.
The infographic embedded above is a snapshot of what that action looks like across various industries and the relative efficacy of those actions.
7. This decade is decisive: More and more proactive climate change mitigation and adaptation will limit damage
This chart shows the risks of extreme weather, wildfire damage, permafrost degradation, coastal geographies, sea level rise and many other impacts are all greater the warmer the planet gets. And more complete and proactive response will limit damage. Chart from the Intergovernmental Panel on Climate Change (IPCC) Sixth Assessment Report.
Intergovernmental Panel on Climate Change (IPCC) Sixth Assessment Report
Acting sooner rather than later is imperative. The next decade is decisive. Total greenhouse gas emissions that can be achieved this decade “largely determine whether warming can be limited to 1.5°C or 2°C,” the IPCC summary report for policymakers said.
Some impacts are unavoidable and/or irreversible, but those impacts can be limited with “deep, rapid and sustained global greenhouse gas emissions reduction,” the IPCC summary report for policymakers said.
And some adaptation options that are possible now will become “constrained and less effective with increasing global warming,” the IPCC said.
“Every country must be part of the solution. Demanding others move first only ensures humanity comes last,” Guterres said.
8. There is a limited window to build a sustainable future
This graphic shows there is a limited window to mitigate climate change enough to enable a sustainable future. The hotter the planet gets, the less likely sustainable adaptation becomes. This chart is from the Intergovernmental Panel on Climate Change (IPCC) Sixth Assessment Report.
Intergovernmental Panel on Climate Change (IPCC) Sixth Assessment Report
The impacts of climate change are cumulative, and so it becomes exponentially harder to create sustainable solutions as time goes on.
“There is a rapidly closing window of opportunity to secure a livable and sustainable future for all,” the IPCC summary report for policymakers says. “Continued emissions will further affect all major climate system components, and many changes will be irreversible on centennial to millennial time scales and become larger with increasing global warming.”